This article is a reinterpretation of an article I wrote in 2021 on my former site. I tried to focus on the essentials, and it outlines the set of Notion pages I created to index my coffee consumption and attempt to build an intuition about understanding my tastes. In general, I think that building a knowledge base is a good practice when trying to explore a discipline. Being far from an expert in both coffee and Notion, it’s likely that much of what I describe in this article may seem naïve! To sum up, this article will present how I set up an infrastructure to index the coffees I taste, with the goal of providing precise metrics to help characterize my preferences, using the Notion tool, while also sharing some techniques and tricks I learned during the creation of this system.
Indexing coffee with Notion
While generally, as long as one hasn’t fallen into the very amusing world of specialty coffee, we tend to simply accept a cup without really caring about the characteristics of what we’ll be drinking. Yet, there are many factors that influence the cup: the origin of the beans, the coffee variety, the drying method, the roast profile, the extraction method, and many others. Much like wine, understanding what one tastes is essential to appreciate specialty coffee and to develop interest in the product — to understand how to choose one’s coffee and how to prepare it properly, while potentially reducing the number of steps needed to approach, based on these characteristics, the ideal cup.
In this article, I will present my use of Notion for building a record of my coffee preparations (a database), allowing me to understand how I appreciate coffee and to be able to define, based on the extraction methods, a recipe suited to attempt to brew cups that match my preferences and, potentially, to adapt to my guests’ expectations!
However, this article is neither a general guide to using Notion nor an introduction to specialty coffee, it is a report on how I decided to organize my coffee indexing in order to collect metrics about my preferences.
About Notion
It’s very difficult to summarize Notion without using the neologism ideator. In general, when I try to describe it to people around me, I present it as a note-taking tool on steroids, allowing the manipulation, among other things, of spreadsheets as first-class values. Over the past few years, this kind of advanced note-taking tool has become very popular, and their versatility places them within the NoCode/LowCode movement. There are many of them, and to my knowledge, the most popular ones (specifically as extensions of note-taking tools) are Obsidian, AnyType, Evernote, and Notion. I don’t have strong opinions about which tool to favor — although, for ideological reasons, I should probably spend more time playing with AnyType, which has the great advantage of being free and local-first. Moreover, much of what I’ll present in this article could work perfectly well with a more specific piece of software, such as Airtable, or even with a traditional relational database. But when I began indexing my coffee consumption, I wanted a generic tool to handle all of my digital note-taking.
Additionally, at the time I wrote the first version of this article, Shubham Sharma was talking a lot about Notion on his YouTube channel and offered a free course to get started with the tool! Moreover, at that time, I was working at Memo Bank, and one of my colleagues, Jonathan Lefèvre, also had plenty of feedback about Notion and, upon rereading the first version, did me the honor of saying (roughly_ in these terms):
It’s always amusing and interesting to see a programmer use Notion, and you too have found a very particular — and slightly unsettling — use for it, at least for the uninitiated.
In short, I don’t know if Notion is the most suitable tool, and I don’t know if I’ve used it in the most relevant way (since my goal wasn’t to drastically increase my productivity), but after 2 years of use, I’m quite satisfied with how much my understanding of my tastes in coffee has improved!
On NoCode/LowCode
I love reinventing the wheel, so it might seem strange that I decided to use proprietary software when I could simply reimplement an entire suite of coffee-dedicated tools! Especially since, in a shared discussion space I used to frequent a lot in 2020, NoCode (back when the term LowCode was still quite obscure) had a very bad reputation.
To be honest, I am very supportive of NoCode/LowCode in the sense that they allow me to focus on the problem I want to address, and even though I am convinced that to use such tools very effectively, it’s better to be familiar with programming (which requires a certain form of logic and modeling skills), my only real criticism of this collection of tools is their name. Indeed, you are always programming, and using a tool called "NoCode" does not exempt you from needing an architect capable of building a relevant solution.
From my point of view, using Notion and the like allows me to have form generation for free, and therefore to focus on data processing rather than data entry, which, in many cases, is a monumental time saver.
However, as mentioned earlier, 2026 will likely be the year I seriously look into AnyType to favor a free and local-first software, because not having to write every line of code, character by character, seems far less problematic ideologically speaking than having to rely on proprietary technologies, over which I have no governance of my own data.
Workspace Organization
Notion allows you to structure hierarchical documents — documents can contain other documents. Each of these documents is a collection of blocks whose behavior varies depending on the need. There are title blocks, paragraphs, images, but they can also reference other documents, document fragments, or even views configured from data sources. The versatility of blocks allows you to neatly organize your workspace.
Since a Notion workspace isn’t limited to a single use, I organized
all my pages dedicated to coffee indexing into one document, simply
called Coffee (to which I added the emoji :coffee: because I’m
modern and I use emojis). This first document serves as an umbrella;
you can think of it as a namespace or a directory. Within this
same document, I add a new database document (associated with the
icon :floppy_disk:) where I will place all my tables. Then, I can
build views (which consume these tables), also within the Coffee
document, to address specific needs. Compartmentalizing raw data
is probably a developer’s quirk, but I’m happy with it.
On Databases
Notion databases are probably one of the most useful features (from my point of view). They allow you to define tables in the same sense as relational databases, with the possibility of including fields that are formulas whose values depend on other fields. This is partly why I consider Notion databases to sit at the intersection of a table and a spreadsheet.
Since there are so many features attached to databases, I will try to explain, throughout the article, the different functions I use (when there might be potential ambiguities).
Initial Features
Now that we have briefly gone over some Notion features, we can turn our attention to coffee, properly speaking. Our exercise will be to try to understand the coffee lifecycle, from tree to cup, in order to extract elements that will serve in modeling our system. Through this modeling, we can describe a collection of tables that will then be used to create views to answer factual questions. From my point of view, this is the most fun part, and I am firmly convinced that, whether you use NoCode/LowCode or fully program the application from scratch, the approach is the same (and fundamental).
From Tree to Cup
To derive relevant models for our indexing, it is important to understand the coffee lifecycle. Indeed, by observing the different stages from the tree to the coffee beans used for brewing, we can isolate a collection of criteria that will influence the cup. Not being (yet, I hope) an expert, it is likely that my understanding of the cycle is naive and clumsy, so I am open to any suggestions for improvement!
Broadly speaking, the coffee trade involves several parties:
- producers, who own coffee farms and handle the drying of the beans;
- exporters, who transport the beans to roasters;
- roasters, who roast the beans;
- merchants, who supply retailers and coffee shops;
- preparers (baristas or the end consumer).
It is obvious that these different parties do not always form completely separate groups. It is very common for a roaster to also be a merchant (or even a barista). But this breakdown of the various parties involved allows us to describe a rough schematic of the coffee journey, from tree to cup:

-
Harvesting:
This stage highlights several criteria. First, the geographical region where the coffee was harvested, and by extension, the producer (or farm) and the altitude of the plantation, the type of tree (naively, Robusta versus Arabica, although in specialty coffee, you almost exclusively find Arabica), the coffee variety, and information related to harvest dates. -
Drying:
As consumers, we are used to seeing only coffee beans (or ground), but the coffee bean is the heart of a cherry. There are several drying techniques — natural, washed, or honey (which has several specific variations) — that strongly influence the taste in the cup. This process is an essential criterion. I plan to write an article entirely dedicated to explaining the different drying processes. In addition to drying, some producers add a step of additional fermentation (which can be, for example, anaerobic or carbonic), which also greatly affects the coffee’s aromas. Given ecological conditions, coffee has become a luxury product, making import costly, which leads some producers to experiment with aromatic alterations during fermentation, further influencing the cup’s flavor. -
Roasting:
Roasting, roughly the cooking of green beans to reveal their aromas, plays a crucial role (obviously) in the final cup. In France, it is generally the roaster who chooses the producers and farms they want to work with, allowing us to extract new criteria: the roaster, the roast level, the aromatic profile of the coffee, and the roasting date. -
Brewing:
The way coffee is brewed also strongly affects the final cup and is determined by several criteria: the recipe used, the amount of coffee, the amount of water, the grind size, the water temperature, the freshness of the coffee, the extraction time, in short, all the variables of the recipe. This allows us to speculate that the overall appreciation of a coffee is recipe-dependent for a specific roast batch.
This is a fairly broad (and, for now, vague) view of the different criteria we will use to describe our modeling. Rest assured, when we explicitly build the tables and views, I will make sure to revisit the different criteria used.
Attentive readers will notice that I haven’t mentioned the export process at all. To be completely honest, I have no idea how it works, and I’m not convinced it’s possible (consistently) to track criteria related to export. That’s why I discreetly allow myself not to worry about it. Additionally, the freshness of the beans used during brewing also affects the cup; storage conditions — type of container, exposure to light, etc. — should ideally be an indexing criterion. However, since I use a fairly consistent storage method (applied to all my coffees), I haven’t found it relevant to highlight in my indexing!
Note on replicability
In the outline of the criteria we’ve selected, the recipe plays a very important role. For indexing to be meaningful, it’s essential to be able to reproduce a recipe precisely and collect as many metrics as possible. Moreover, imagine savoring the most delicious cup you’ve ever made — it would be terrible not to be able to reproduce it due to measurement inaccuracies! For this, I use a collection of precise tools:
-
A click grinder, the Comandante C40. A click grinder allows precise control over the grind size, and the Comandante is a very versatile grinder whose click settings have become almost a standard for adjustment. The grinder is truly an essential tool, as coffee loses a large part of its aromas 15 minutes after grinding.
-
A scale, the Brewista Smart Scale 2, precise and equipped with a timer, which I use to weigh the coffee and water. (This helps me avoid volumetric measurements, which are often imprecise and difficult to replicate.)
-
A kettle with precise temperature control (allowing degree-by-degree adjustments) and ideally a gooseneck spout (for pour-over coffee). I use the Artisan Electric Gooseneck Kettle, also from Brewista.
Table modelling
Even though normally one wouldn’t start by building user stories to
derive a relevant model, since a Notion workspace is easier to evolve
than a database used in production, and the somewhat naive mapping of
the coffee lifecycle gives us intuitions about which variables we’d
like to track, I allow myself to build tables that will help describe
the data I want to exploit in specific views. We can therefore
populate our database document with tables. All of these tables are
organized by theme, but I think for the purposes of this article, it
isn’t necessary to document this organization (which is somewhat a
matter of personal preference).
Describing farms/producers and roasters
Even though I became interested in farms and producers relatively late, by tasting more and more coffee, I have learned to identify farms whose harvests I consistently enjoy (for example, the extraordinary Finca Hartmann from Panama). So before describing a farm briefly, it is important to be able to locate it geographically.
A first set of tables: geographical areas
Let’s tackle our first modeling exercise, where we will face the construction of relationships between tables! My model is fairly simple: I distinguish 4 tables — Continent, Country, Region, and City. These 4 levels provide sufficient granularity (even though the terminology is not uniform across all countries; for example, in Panama, one would refer to a corregimiento rather than a region).
I don’t need information other than the name (which serves as the
index) and a relational hierarchy following this order: cities -> regions -> countries -> continents. Here is a schematic view of the
geographic model (which I placed in a document named Location):

You’ll notice that I added dashed relations (labeled rollup). In Notion, there are two types of relationships:
- Standard relations, which reference another table directly;
- Rollups, which describe a relation field. This is very similar to Delegates in object-oriented programming. In other words, a Rollup is a virtual field computed from a relation.
Rollups allow adding context to a table and should not be filled
manually. For example, once I name a region and assign it a country,
the continent field is automatically computed. However, there is a
small restriction with Rollups: you cannot create a Rollup that
takes another Rollup as its source. Rollups always take relations
as their source. In the modeling schema, you can see that in
cities, I list both the country and the continent it belongs
to. According to the rule about Rollups of Rollups, this should be
impossible. But there’s a trick!
The Mirror Field Technique
In our example, we have the tables continents, countries,
regions, and cities. For readability, I want:
- entries in
countriesto list their associatedcontinent; - entries in
regionsto list theircountryand, transitively, their associatedcontinent; - entries in
citiesto list theirregion, and transitively theircountryandcontinent.
We know that:
- Relations allow referencing an entry directly;
- Rollups allow targeting a field of a reference (transitively).
Since a Rollup always uses a relation as its source, it is not
possible, in the case of cities, to pull up the continent — this is
actually the only table where the problem arises. country can use
only one relation to express its continent, region uses a relation
to express its country and a Rollup to bring up the continent, and
in the case of cities, a relation expresses the region, a Rollup
brings up the country, but we cannot directly bring up the
continent.
To allow cities to access the continent from regions, it is enough
to use a mirror field, which I called _mirror_continent. This
will be a formula equal to prop("Continent"). This creates a second
field that is strictly equivalent to the Continent field, except
that this field is not the result of a Rollup (even though Continent
itself is). It then becomes possible to reference this field from
cities by creating another Rollup pointing to the region and
referencing our new _mirror_continent field, which is not the result
of a Rollup computation, making the continent a city belongs to
explicit.
For enthusiasts of encapsulation, Notion makes it easy to hide
fields from the main view, keeping our regions view easy to read. In
the rest of the article, I won’t specifically distinguish between
using a mirror field or a Rollup, as the former is just a technical
detail necessary to work around an inherent Rollup limitation.
Describing farms
Now that we can locate a farm, we can describe them. The exercise isn’t very complicated. Indeed, I simply list the fields that allow me to build a directory of farms:

I need a name and a website (or social page) and to reference
the city where the farm is located. More generally, I find it
useful to have quick access to the country, which is why there is a
Rollup (requiring the addition of a mirror field on country in
cities). Now, we can describe the roasters.
Describing roasters
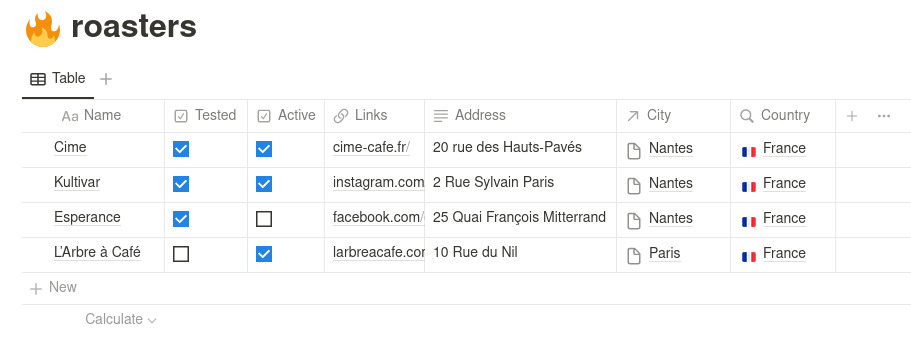
Describing roasters isn’t fundamentally different from describing farms. You’ll find common fields — Name, City, a Rollup from the city to the Country, and a URL. I added a precise address (mainly to reference a street), as it’s more common that I want to visit a roaster’s shop rather than the producer’s farm, and two boolean fields to indicate if I have already tried their coffee and whether the roaster is still active.

Keeping inactive roasters allows me to maintain consistent indexing. Having a marker indicating whether a coffee from a roaster has already been tasted/tested enables the creation of a first tool. However, once our model is richer, it will be possible to automate the computation of this field.
A first tool: coffee roasters to try
One of Notion’s strengths is that it allows you to build data prisms, that is, views that apply filters and sorting methods to existing databases. This makes it easy to create a view that lists all the roasters I haven’t tried yet.
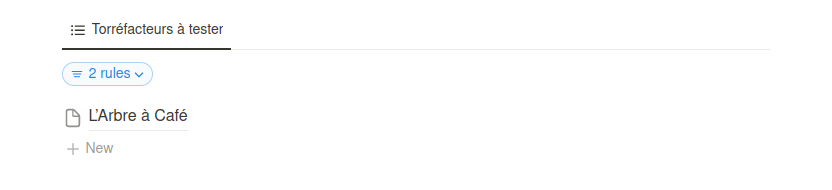
For example, using this roasters table (with a very small dataset),
we would want a view called Roasters to Try to display only L'Arbre
à Café.
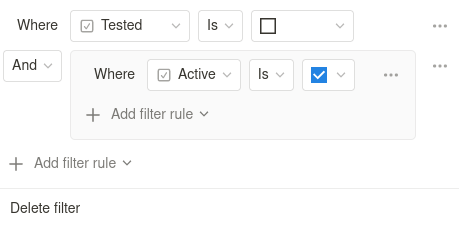
To do this, simply create a view (with the List layout) and add
an advanced
filter
specifying that the Tested field should not be checked and the
Active field should be checked. In my view, building advanced
filters is quite intuitive:
Which, logically, produces a view showing only active and untested roasters.
It’s partly for this kind of possibility that I decided to use Notion at the time. There are several view templates (for example, one that displays data as a Kanban table), and combined with sorting and filtering, it is possible to create specific views (which can be embedded in other documents) to answer very precise questions. Later in the article, we will illustrate other uses of these views.
Modeling Coffee, Varieties, and Beans
We can move on to what I consider the most fun part: describing the coffee! Even though there are over 130 species of coffee plants, we generally distinguish two main ones used for making coffee: Arabica and Canephora — commonly called Robusta. In specialty coffee, you will almost exclusively find Arabica, which is harder to cultivate but produces higher-quality coffee. Next, there is a very large collection of coffee varieties derived from Robusta and Arabica, called Cultivars (or cultivated varieties). In the following sections, we will model the tables describing coffee varieties and then describe roasted beans.
Describing the different varieties of coffee
A first design question arises quite directly. Although we know that
generally there will be a distinction between Arabica and Robusta,
should we dedicate a table to describe the coffee plants, or can we
just consider it a compact field — for example, is_arabica, a
boolean where false would imply the plant is Robusta? I don’t have a
strong opinion on the best approach, so I will dedicate a specific
table. This allows me to use the page attached to an entry — in
Notion, it’s possible to add additional content to each table entry —
to collect notes related to the coffee plants. We can therefore
describe the varieties in this way:

The species (species) aren’t very original; I just store the short
name and the full name. Then, for the cultivars, I store a
name, a link (usually pointing to the excellent World Coffee
Research index), a list of
alternative names (for example, the Villa Sarchi variety is also
called Villalobos), a species (Arabica or Robusta), and
potential parent cultivars.
Referencing parent cultivars allows us to capture artificial or natural genetic mutations. For example, Bourbon Rose is a natural mutation of Bourbon (one of the most popular cultivars), and Mundo Novo is an artificial mutation of Typica (probably the oldest variety) and Bourbon. This level of detail might seem like a nicety, but I find that having an approximate idea of a cultivar’s lineage provides a better understanding of its characteristics.
Now, we have all the tables needed to describe roasted beans.
Describing the roasted beans
We now have all the ingredients to describe the bean we will use to make a cup. This will naturally be one of the most complex tables in our system. Logically, it will include producers (farms) and roasters, the regions (one might think that the producer alone would suffice to describe the region, but I’m not sure all farms are entirely contained within a single region, and some beans may result from collaboration between two farms, where one provides the cherries and the other handles fermentation, hence my need to duplicate the region), the list of varieties (when a coffee consists of a single variety, it is called a single origin; when it contains multiple varieties, it is called a blend), and other fields that I will describe after presenting the structure (to avoid overloading the diagram, I’ve taken the liberty of not reproducing the relation tables):

This is the model that, in retrospect, required the most thought and
still has some shortcomings. The fields Cultivars, Farms,
Roasters, and Regions accept multiple relations to account for
collaborations and potentially blends.
The process is described by the Process field, which allows
selection from a list of drying methods. This list can obviously
evolve over time, although after several years of tasting coffee, it
seems exhaustive to me.
Next, we can characterize the fermentation, which we will enumerate. As of now, I’ve observed no additional fermentation (or aerobic coffee), anaerobic fermentation, carbonic fermentation, and lactic fermentation (this list can obviously change with new discoveries). In addition to the additional fermentation process, it is important to record the fermentation duration (in hours). Unlike Excel, it isn’t possible to invalidate this value when no fermentation occurs; however, it would be possible (though perhaps a bit excessive) to add a formula field that uses the value of Fermentation_duration if fermentation is not None and returns 0 otherwise.
Soaking during fermentation is a boolean (for which the same
technique could be applied as for fermentation duration, since soaking
only makes sense for additionally fermented coffee). One might regret
the absence of the fruits or aromas used for soaking, but in my
experience, the list of flavors (Flavours) provided by the
roaster is sufficient to form an opinion.
The roast level is a fairly imprecise indicator. In specialty
coffee, values like dark and extradark are almost never used, as
roasters generally aim to preserve the trace of the
terroir. Typically, the higher the roast level, the more the coffee
tends toward bitterness, which is generally a characteristic one wants
to avoid (or at least control). After several years of use, I
generally only use the values light and middle. Since there is no
real consensus on roast level classification, my approach is quite
approximate.
The Altitude field may seem surprising; indeed, we could have placed it at the farm level. However, I imagine that some farms may extend their plantations over several hectares and therefore potentially across multiple altitude levels. I haven’t yet found a compact and ergonomic way to manage blends of multiple beans from multiple harvest levels.
The final field is the SCA Score, a score designed to grade specialty coffee, established by the Specialty Coffee Association. Its value is therefore a highly revealing indicator of the overall quality of the coffee.
Even though the model is, unfortunately, not perfect, in my view it is sufficient to build a solid intuition about my general appreciation of coffee.
Trivial improvement
When I shared the article on various networks, Quentin
Rault kindly pointed out in this
conversation
that I could split the beans model into two models:
GreenBeansdescribing the beans before roasting;RoastedBeansdescribing the beans after roasting (which maintains a relation withGreenBeans).
The advantage of this separation is that it avoids information redundancy when roasters roast the same green beans. Indeed, producers sell the product of their harvests to several different roasters. This is therefore a trivial improvement that greatly enhances the model.
A second tool: diversifying experiences
As in many disciplines with varied parameters — and here, the number of fields describing roasted beans and the number of drying processes promise a lot of diversity — experimenting with as many of these parameters as possible is crucial! That’s why, by using a view, such as a Kanban view based on the drying process, for example, it is possible to quickly get a panoramic vision of the beans that need more testing. In 2021, after building the first iteration of this table collection to index my coffee, the Kanban view of roasted beans quickly made me realize that I had somewhat neglected Honey coffees, allowing me to adjust my purchases to diversify my coffee knowledge! With this relatively modular model, it’s possible to play with views, their dynamic feeds, and filters to highlight low-consumption signals.
Now, we can move on to the final modeling step, which will leverage all the previous steps: the recipes!
Modelling recipes and experiments
Even though we’ve modeled a few tables and can relatively precisely
describe roasted beans, it’s noticeable that at no point have we
captured the interpretation (whether we like a cup or not). While we
could have added a Personal_score field (in contrast to the SCA
score) in the roasted beans table, I think it would have been a
somewhat vague field. Indeed, although it is possible to extract a
lot of information from our current model, there are still many
parameters that, in my view, should not be associated with the
description of the beans. The freshness of the coffee (its roasting
date) and the preparation method play a crucial role in the
appreciation of a cup.
Storing recipe experiments has allowed me, over time, to adjust chosen recipes based on the characteristics of the coffee, but also to fine-tune the default parameters of a recipe to approach the ideal recipe on the first try. To enable meaningful entry of preparations, we will separate the description of the recipe from its experimentation. But before describing the recipe, let’s look at the description of the coffee machines.
Describing coffee machines
Even though, quite naively, one might think that describing a coffee machine only involves giving it a name — and therefore doesn’t require a dedicated table — it quickly becomes clear that for convenience, we want a hierarchical representation.
Indeed, to characterize a machine, I can either use a Multi-Select, giving me flexibility regarding the level of granularity I want, or I can describe a set of hierarchical tables. In the original version of the article, I used a multi-select, but in this revision, I decided to use two tables: the first allows me to describe the machine category (for example, Pour Over, French Press, Aeropress, Espresso, etc.), and the second describes the specific coffee maker in more detail.

Nothing special to note, but this breakdown allows us to describe a recipe for a category of coffee makers and associate an experiment with a specific coffee maker. Now, we can move on to describing a recipe.
Describing a recipe
Now we can move on to the fun part: describing a recipe! For this, we’ll use a Notion feature I mentioned briefly when describing coffee varieties. Indeed, an entry in a Notion table automatically attaches a document. We’ll use a table to describe the recipe’s metadata, and then use the body of the entry to detail the different extraction steps. Previously, I experimented with finer levels of modeling, treating the steps as entries in a table as well, but it was quite uncomfortable, and the over-normalization made describing a recipe cumbersome.

The first fields are quite obvious: we name the recipe, assign it a source (usually the page or video describing it), and associate it with a machine category. Since some recipes are specifically designed for a particular machine, the Recommended Machine field allows us to capture this detail.
The water temperature is a factor that greatly influences the recipe, as does the grind size (which I count in the number of clicks on my Commandante C40 grinder). The final field, the ratio, allows us to compactly express the water-to-coffee proportion.
Ratio explanation
In coffee preparation descriptions found in the literature, it’s
common to encounter a ratio. The ratio is a compact notation that
describes the relationship between the amount of water and coffee
needed for a preparation. This notation avoids the imprecision of
volumetric measures (for example, 2 tablespoons of coffee) and relies
solely on weight. Typically, the ratio is expressed as 1:X, which
can be read as 1g of coffee for Xg of water.
For example, a ratio typical of gentle brewing methods, 1:18,
allows you to quickly calculate either the amount of water needed for
a given portion of coffee or the amount of coffee needed for a given
portion of water (the magic of arithmetic):
- For 20g of coffee:
20 * 18=360gof water - For 240g of water:
240 / 18=~13gof coffee
In my model, I only store the X from the formula, with the 1 being
constant, which allows me to use it numerically in a tool.
A third tool: a Ratio assistant
Now that we understand the ratio, we can create a new tool that allows us to define the amount of water to use for a specific recipe based on a given amount of coffee. We often prefer to calculate the water amount from the coffee rather than the reverse because it’s usually the coffee quantity that dictates the recipe, not the other way around, and generally, we choose the coffee before pouring the water.
To do this, we’ll create an inline database on our tools page,
which will contain only a single entry. In addition to the name, it
will have 4 fields:
Recipe, a relation to the recipe we want to use as a base;Ratio, a rollup on theReciperelation pointing to theRatiofield, allowing the recipe’s ratio to be accessible;Coffee, a numeric field that will hold the amount of coffee used;Water, aformulafield that will display the required amount of water.
Now that our fields are set up, we can build the formula. Even though
the arithmetic operation is very simple, Notion’s relation model
introduces a few complications. Indeed, it is not possible to
enforce that a field has only one relation, which means the formula
must be written like this: prop("Coffee") * prop("Ratio").at(0). This can be read as: multiply the "Coffee"
property by the first value of "Ratio".
This tool highlights some inherent limitations of Notion, which can be annoying when trying to build more ambitious tools:
- The impossibility of defining a unique relation;
- The impossibility of setting a maximum table size. Here, we would like to limit our table to a single entry to create a true widget;
- The requirement of having a primary key (
Name), which, in the case of a single-entry table, doesn’t really make sense.
Even though these issues exist and are closely tied to Notion’s table-oriented model, it is often possible to find a solution (sometimes a bit verbose) to work around the problem.
Describing an experimentation
At this stage, we have all the building blocks necessary to truly characterize our tasting experience! We can now describe each experience. An experience is the application of a recipe with a specific machine and specific beans. This is the part that will finally allow us to gather appreciation metrics. In other words, an experiment is both a variation and a specialization of a recipe.
Since a recipe serves as a guide, some parameters are duplicated to allow adjustments based on the coffee used or the machine. As with the steps of a recipe, we can use the document attached to each entry to collect additional notes.

Many of the fields have already been described in the previous models. Note that for each recipe, I store the roasting date, which is an important indicator of the freshness of the roasted coffee. Indeed, it is common to let the coffee degass for a few days after roasting. Personally, I tend to let the coffee rest for up to a week post-roasting and consume it within the following three weeks.
The Personal Score is a rating (out of 20) that allows me to capture a general impression of the quality of my cup. This is why it’s important to record the time at which I consumed the coffee (here, the Date field), because some coffees, in my view, aren’t suitable for the morning (for example, fermented coffees). This field will be crucial in the following sections, as it will allow us to extract interesting metrics.
The Ratio field allows us to calculate the ratio (logically) based
on the amounts of water and coffee, and its formula is quite simple:
prop("Water_quantity") / prop("Coffee_quantity").
The Coffee Freshness field is a simple subtraction, showing the
result in weeks between the preparation date and the roast date,
represented by the following formula:
prop("Date").dateBetween(prop("Torrefaction_date"), "weeks"), which
demonstrates that Notion’s formula language is also very expressive
when working with dates.
We have finished the modeling. At this stage, the exercise of entering this kind of information is already, in my opinion, a significant step toward understanding one’s coffee preferences. We will conclude by leveraging a relationship-based feature to build refined summary tools.
More dashboards
Now that we have a complete data collection foundation, we will look at how to slightly modify our models to extract fun and relevant insights. For example, how to sort my favorite coffees, highlight the farms that produce the coffees I enjoy most, or identify which machines produce the results I like best. In the current setup, collecting all these metrics dynamically is quite challenging. However, thanks to a very useful feature in Notion, it is possible to implement them.
For this article, we will focus on a single problem: based on experiment scores, how can we sort:
- the coffees I prefer;
- the roasters that give me the most satisfaction;
- the farms/producers that produce the coffees I enjoy the most.
By working through this example in sequence, a series of increasingly complex dashboards becomes trivial to implement. To keep the article from ballooning in size, we will stick to this single example.
Bidirectional relationships
In a relation’s properties, there is an option called Show on relation_source. When checked, it adds a field in the source of the
relation that lists all entities linked to a given entry. For example,
if in the experimentations table I check Show on for Beans, then
for each entry in Beans, I will see all the experimentations based
on those beans. Coupled with Rollups, this allows aggregating
values and surfacing insights automatically.
Bidirectional Relations and Rollups: Average Score
Now that all our experimentations are accessible by beans through the
Beans table, we can add a Rollup pointing to the
experimentations field, selecting the Personal_score property and
using Average as the calculation function. This will compute the
average of personal scores for each bean. To apply the same logic to
calculate the average score of a roaster or a farm, we duplicate
this calculated field using the mirror-field technique (since the
average is the result of a Rollup) and make the relations between
roasted beans and roasters/farms bi-directional. Then, in the
Roasters and Farms tables, we can add a Rollup on these newly
modified relations, again using the Average calculation
function. This way, each roaster and farm will display an average
score reflecting all experimentations of the beans they produced.
We now have an average experimentation score per bean, an average bean score per roaster, and an average bean score per producer. This setup allows us to create dedicated views to display my favorite beans, my favorite roasters, and my favorite farms!
For me, after several years of indexing, Finca Hartmann is the farm to which I have given the highest score, and Cime is the top-rated roaster.
By leveraging the bi-directional propagation of relations, mirrored
fields, and Rollups, it’s possible to surface interesting metrics, and
the possibilities are incredibly varied. For example, one could even
automate the calculation of the tested checkbox using a similar
approach—if there’s at least one experimentation referencing a roaster
(in other words, if the experimentation field isn’t empty), then it
can be marked as tested! This concludes my process and coffee indexing
system; it’s time to wrap up.
To sum up
The article, unfortunately, turned out to be longer than I had hoped, and I think that to conclude properly, this section should be divided into several parts. The first will focus on the concrete benefits of the indexing tool, the second on Notion and, more specifically, on LowCode, and the last will touch on the hypothetical future I envision for this system.
In any case, I hope this article has conveyed, even a little, my passion for coffee! It’s a fascinating world, driven by fascinating people. Much of my interest in coffee truly began to develop thanks to Clément during the days of the now-missed Coøk Kaffé, which allowed me to discover April. It deepened thanks to the expertise of Baptiste and the entire team at Cime, whose coffee is excellent (and has become my favorite roaster), with a special mention for Substance, where every reservation promises an incredible journey and discoveries, enriched with loads of information about the terroir, producers, and brewing methods, and Kultivar, which gave me the opportunity to taste very original and exotic fermented coffees!
What makes the specialty coffee world even cooler than just being able to drink good coffee is that it’s lifted by people who are generous with advice, discussion, and sharing!
After ~2 years of use
Before I started meticulously recording my experiments in the index presented in this article, I primarily relied on the branding and artistic direction of roasters to discover new coffees. Using an index allowed me, during a discovery phase, to deliberately diversify my choices, to understand — contextually — the appeal and appreciation I could have for certain coffees, and to build a strong intuition about the aromas and the acidity/bitterness balance I usually look for in a cup. It also helped me find relevant first settings to experiment with new coffees. Moreover, the exercise of documentation is truly a fantastic tool to stabilize one’s knowledge, and even though I still consider myself very much a beginner in the coffee world, I believe I have been able to learn more and progress significantly thanks to this meticulous indexing.
In short, I believe that in many disciplines, building indexes, knowledge bases, or dictionaries is a valuable practice. For me, creating this coffee index has been genuinely useful, while also allowing me to produce two articles — which, given my almost nonexistent writing productivity, is quite the bonus!
On Notion and LowCode
Even though, as a developer, one might regret some of the necessary workarounds, I found Notion ergonomic and really fun to use. From my perspective, the model—sitting at the intersection of relational tables and spreadsheets — is highly versatile, and when combined with its API, it can be used as a true back-end, quickly providing a UI for structured data. This was my first LowCode/NoCode experience (outside of Excel), and I wasn’t disappointed. Even using just a small subset of the application (and missing out on many features), I was very impressed by the prototyping speed that such a tool enables.
I will continue to keep an eye on alternatives (ideally open-source and local-first) and keep experimenting with LowCode technologies to solve problems I don’t particularly want to develop from scratch. If you have any feedback — positive or negative — about Notion, or suggestions for LowCode/NoCode tools to try, don’t hesitate to reach out; I’d be delighted to explore them.
In short, although it’s not possible with Notion to build everything that could be built with a full relational database and a dedicated front-end, the tool covers a huge number of use cases and offers a very high level of generality, combined with excellent ergonomics. It’s probably worth seeing what LowCode has to offer. In my case, Notion allowed me to benefit from a graphical interface — more or less ergonomic — based on data description and structure, for free.
The Sequel
The construction of the system and its documentation (this article and its predecessor) were fun exercises, resulting in a tool that I use daily. However, I believe that to make it generically ergonomic — meaning usable by someone other than myself, and therefore potentially publishable as a template or at least distributable — there is still a lot of work to do. Throughout this article, I’ve pointed out small points of frustration. They might exist only because I don’t fully master Notion (and if that’s the case, please don’t hesitate to contact me to explain how to improve my system), but I think that, like any tool so versatile, designed to be easy to pick up, it’s impossible to precisely define certain relational constraints or formatting rules. That’s why it’s conceivable (hypothetically) that I might develop a dedicated software (free, of course) to relax all these constraints!
In any case, the Notion prototype is extremely helpful, as it provided a first modeling, making the use of LowCode as a prototyping tool perfectly relevant.
Finally, don’t hesitate to drink good coffee, ditch the Nespresso machines, stop buying over-roasted supermarket coffee (like Carte Noire or Grand Mère), and allow yourself to enjoy specialty coffee — cultivated, harvested, dried, and roasted with care. It’s far better. Promise.